Project #6 Data Portrait
Try to move & press your mouse
Description

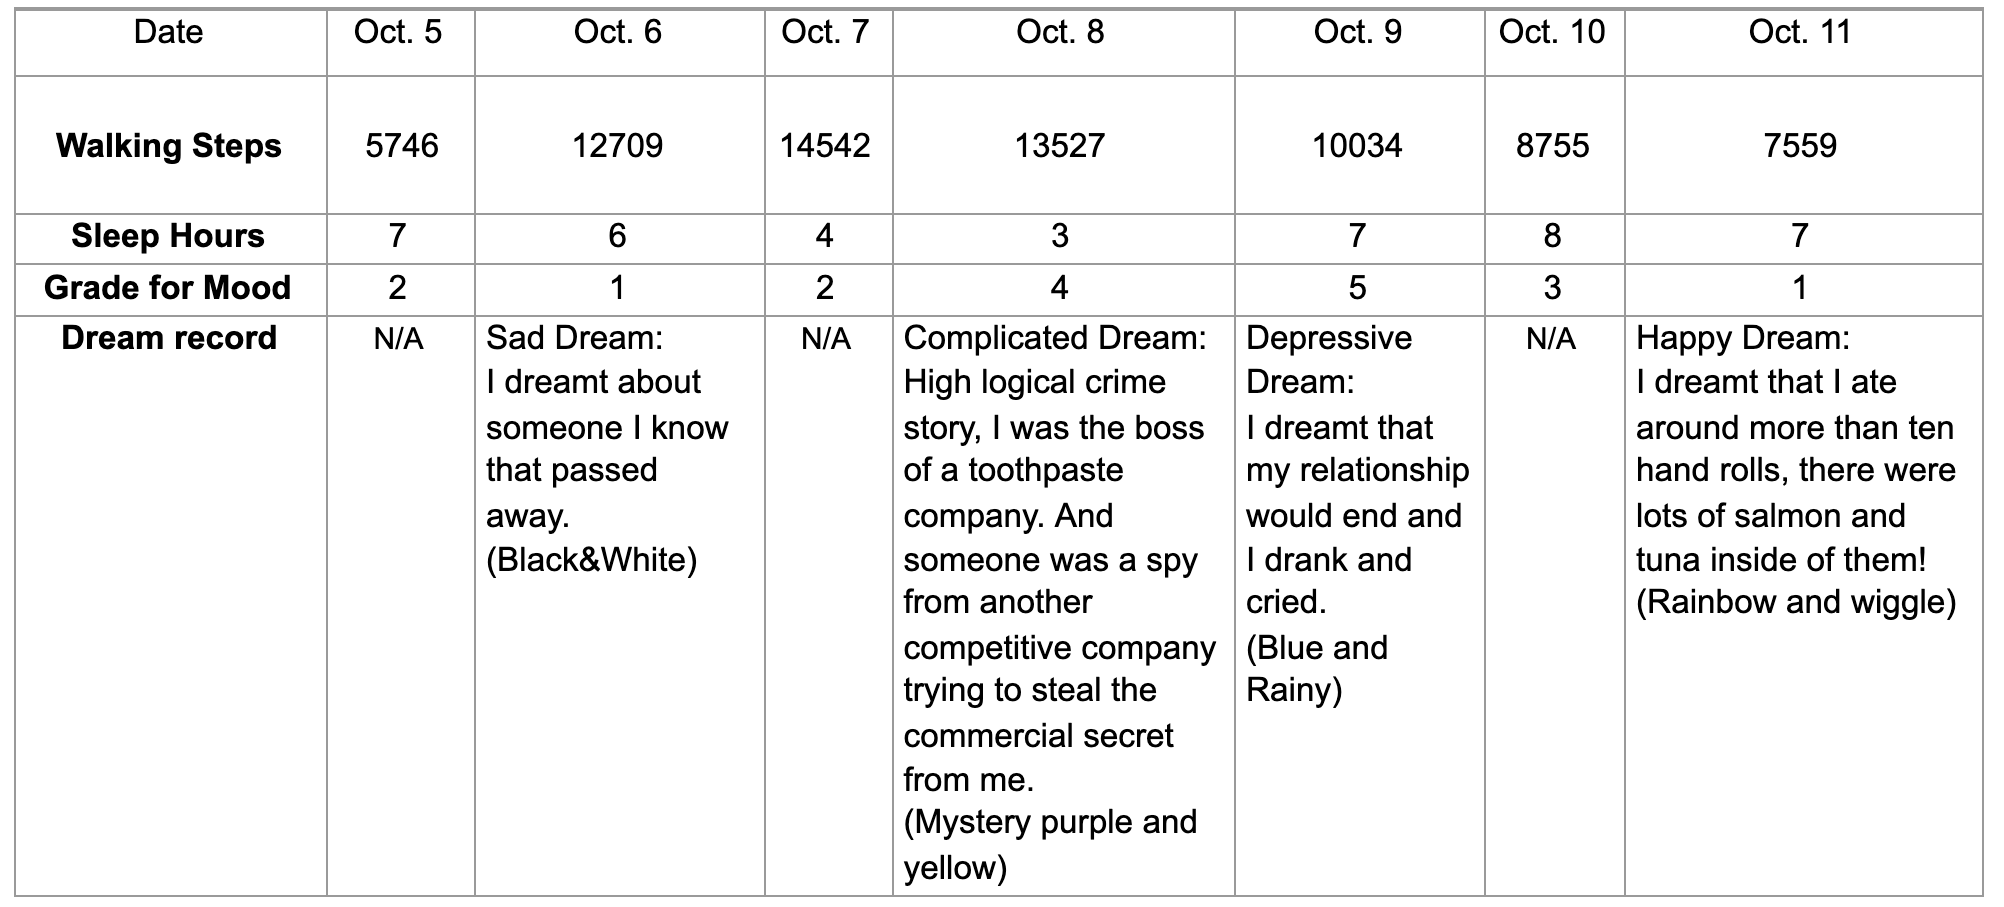
This table is about tracking my personal habits for a week, which includes walking steps, grades for mood, sleep hours and dream records. I am trying to collect the most basic data of my daily biological activity. I think during a busy life, the most basic biological habits and regularities are often the ones that I tend to overlook. I want to refocus on my biological clock through this assignment.
Instruction
The four portraits I created in different styles and colors were inspired by Andy Warhol. each painting represents a dream I had during the week, and I recorded my dreams, using different colors by encapsulating the emotions each story brought to me. I placed the walking steps data in the middle of the canvas as a separation between each portrait. And transformed the sleeping hours into the diameter of the second quadrant ellipse using an array to keep them changing. In addition, I scored my daily mood from one to five. And transform them into the rectangle side length of the first quadrant so that by mouse click, the user can get different pixels to switch between the images.Finally, the third quadrant is a rainy self-portrait, where the volume of rain can be changed by moving the mouse.
Design Process
This table shows the number list of my data collections. I tried to record my dream content once I wake up. I combined data self-portrait and self-portrait to form a true digital "self-portrait" where I translate the different emotions in my dreams into different colors. The framework of my overall design was to show four images of me in my dream. And I elaborate them in a sequence of four quadrants. The first quadrant is in the upper right corner, which is pixelated in black and white, I dreamed that someone I knew died, and I used black and white to express the mood of grief and helplessness at that time. The second quadrant is in the upper left corner, it is yellow-purple pop style, I dreamed that a spy from a competing toothpaste company came to steal my company secrets, very logical all and very absurd. The third quadrant is where I dreamed, I broke up on a rainy day and I created an image with a blue tone and a rain effect. In the fourth quadrant, I dreamt that I ate delicious food, so I was very happy, so I created this part with rainbow as the main color.Other data including walking steps, sleep hours and mood grade were transformed into different parameters and applied to the four images. walking steps were placed in the middle of the different style images as an isolation layer, sleep hours were transformed into the diameter of the ellipse, and mood grade was transformed into the size of the pixel.
Reflection
Through this data collection process, I discovered that many habits that I thought were regular in my life actually differed. This assignment gave me a deeper understanding of my body and how personal habits affect many aspects of daily life. As these own data generated self-portraits, I realized that data visualization is a very clever way to combine visual art and scientific theory. Not only do they make perceptual artwork more rational, but they can also make rational data more readable. In this process I transformed a lot of data into abstract elements and applied them to the portraits. Although it looks as if there are four self-portraits, the size of each element is created by the data I collected.